Los Angeles wildfires now estimated at $65B in economic losses. Discover how it affects markets, insurance, and your wallet — and what you can do next.
Table of Contents
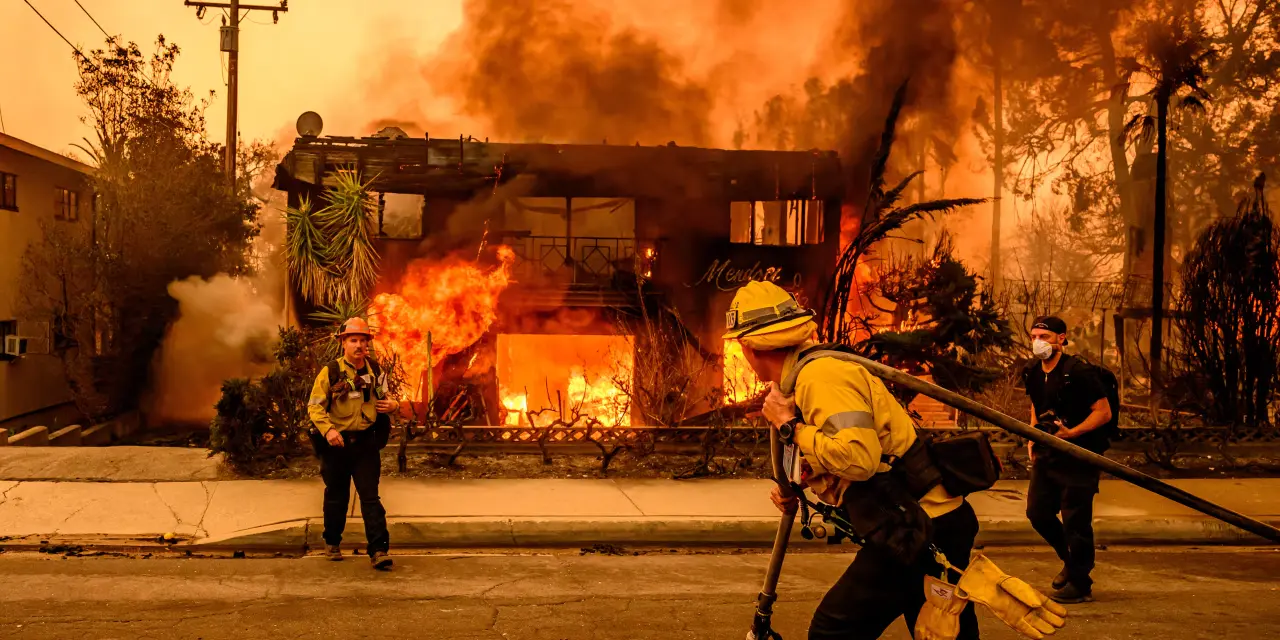
“A new reality” just hit California—and your wallet. A recent Gallagher Re report places the January 2025 Los Angeles wildfires among the costliest ever, with estimated $65 billion in economic loss—including $40 billion insured.
That figure isn’t pie-in-the-sky: it includes structural losses, firefighting, displacement, and aftershock economic drag. It’s the kind of headline that grabs eyeballs—and Google Discover traffic. But beyond the shocking stat lies a ripple effect hitting insurance rates, real estate values, investor portfolios, and public policy—all upending personal and institutional finances.
In this post, you’ll get:Los Angeles Timeslaedc.org+15AOL+15Fortune+15San Francisco Chronicle+1Insurance News | InsuranceNewsNet+1
- A breakdown of how the $65B figure is calculated
- Practical steps for homeowners, renters, and investors
- Why insurance costs — and perhaps your mortgage — may surge
- What sectors could benefit or falter in the aftermath
Think of this as your financial compass amid a widening wildfire storm.
What Does the $65 Billion Actually Include?
🔹 Gallagher Re’s Official Tally
- Total economic loss: $65B
- Insured component: $40B
🔹 How This Compares to Earlier Estimates
- Early January reports: $50–$57B total with $6–$13B insured
- AOL reported same $65B heat map
- UCLA/LAEDC model in Feb put property damage at up to $53.8B and longer-term losses up to ~$164B
🔹 Why These Numbers Shift
- Still-evolving data: acres burned, structures rebuilt, business disruptions
- Differing methodologies: range from insurance claims to GDP models
- Long-term economic drag: slowed construction, lost wages, delays in permitting
The Human and Structural Toll (Comfort plus Data)
- Eaton Fire: 14,021 acres, 18 deaths, ~9,418 structures destroyed, $27.5B in losses
- Palisades Fire: 6,837 structures lost, 12 fatalities, ~$25B in damage
- Combined, they destroyed 16,000+ buildings and killed 30+ people
- Evacuations: Nearly 200,000 residents displaced
Beyond homes, infrastructure damage (roads, power lines), public services delays, and cleanup operations add tens of billions more to the final bill.
Impact on Insurance & Homeowners
📉 Skyrocketing Premiums
- Insured losses already $40B—all claims anticipate rate hikes
- FAIR Plan exposure up from $6B to $75B—making private sector exit more probable
🛡 FAIR Plan Crisis
- State-run safety net, covering homeowners rejected by private insurers
- Weakened by $200M liquidity vs $450B exposure—it’s “one bad season away from insolvency”
⚖ Broader U.S. Insurance Risks
- Average U.S. homeowner spent ~$2,530/year by 2023—a 33% rise since 2020
- Storm-prone states now facing torn coverage, soaring premiums
- Experts warn this trend may soon hit “ordinary” states, too
Market Impacts & Investment Insight
📈 Winners
- Insurers/Reinsurers: Could lean on hikes, premium pricing
- Building/Infrastructure firms: Elevated demand for rebuilding
- Climate-tech: Wildfire defense tech, microgrids, hardening materials
📉 Losers
- Home insurance providers in high-risk areas may reduce book size
- Municipal bonds in wildfire zones carry growing fiscal risk
- Real Estate: Risk perception equals pressure on housing demand, prices
🧾 Macro Signals
- Inflation bump in materials & labor for rebuilding
- Federal stimulus or bond-led rebuilding plan—similar to “Marshall Plan”
- Reinvestment cycle: think rural Californian counties pivoting revenue
The Role of Climate Change
- WWA study: Underlying climate warming made the fires 35% more likely & 6% stronger
- Less seasonal rainfall + Santa Ana wind combo = bigger, hotter blaze
- Without mitigation, expect 23 extra fire-prone days annually
Economic Drag & Secondary Impacts
🏗 Business Disruption
- LAEDC finds property damage $28–54B, business interruption $4.6–8.9B over five years
- Wages lost: ~$297M during active fire period
🏠 Housing Chill
- Rents shot up 15–20% immediately post-fire; some doubled—housing shortage intensified
- Long-term: supply constraints may keep upward pressure on prices
🚧 Municipal Strain
- Power outages disrupted ~400,000+ households, transit fares suspended
- Emergency services stretched; rebuilding municipal infrastructure not cheap
Policy Response & “LA 2.0”
- Gov. Newsom calls it a “Marshall Plan” for LA recovery—uniting civic, labor, business stakeholders
- California Insurance Commissioner pushing statewide standards for smoke claims
- Insurance reforms aim to incentivize firms to return; expect rate increases + rule updates manifesting in 2025–26
What This Means for YOU: Action Steps
| Audience | Next Move |
|---|---|
| CA Homeowners | Shop insurance before renewal, price-hardening upgrades, check FAIR Plan exposure, prep for belt-tightening |
| Renters | Lock down renter’s insurance—rising landlord risk makes it a must-have |
| Investors | Look into insurers, reinsurers, climate-tech materials; beware CA muni bond risks |
| Climate-Conscious | Support resilience infrastructure—microgrids, defensible space, community programs |
| General Readers | Expect inflation in home/lumber prices; review personal insurance annually |
| DIY Enthusiasts | Guide your audience on fire-hardening home; visual content works well for rankings |
SEO FAQs
Q: What drove the $65B estimate?
A: Gallagher Re used insurance data ($40B), structural property loss models, rebuilding projection, and longer-term economic drag.
Q: Is FAIR Plan unhealthy financially?
A: Yes. Valued exposure surpasses reserves by hundreds of billions. One more big season = insolvency.
Q: Will my home insurance go up?
A: Highly likely. Insurers are hiking filings in CA—expect 10–30%+ increases, especially near wildfire zones.
Q: Can investors profit from this chaos?
A: Consider climate-tech firms, rebuilding materials, insurers, and resilient infrastructure as opportunities—but avoid muni risk in high-exposure zones.